
Transifex Native Analytics
Transifex Native Analytics is available for all Native projects that have a resource. On the related page, you can check out usage data and get insights for your Transifex Native resource.
Checkout a brief overview for the analytics page in this video.
To access Transifex Native Analytics:
- Select your Native project and navigate to the Source Content page
- Select the FILELESS resource displayed in the list of resources to view more details about that resource.
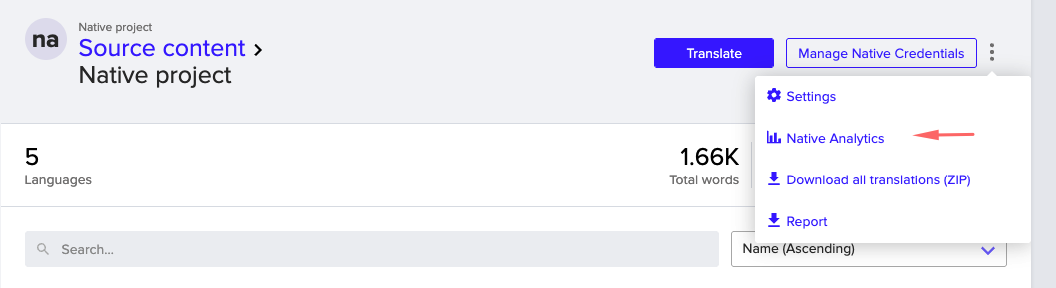
- Click on the three dots menu and choose Native Analytics.
The Native Analytics page
By accessing this page you can filter specific dates and check data and insights for your Native project.
On the page header, you can see:
- A breadcrumb with a link back to your Native project resources on the left
- A date picker to choose the period you want to see Native data and insights for
Expanding the date picker and choosing the period you are interested in will automatically update the date on the page.
Navigating the rest of the page you can see a set of graphs on the left and an insights box on the right of the page.
Usage graphs
The displayed usage graphs are breaking down usage by unique visitors. Unique visitors are measured by storing anonymized calls to the SDK for a specific language.
For server-side SDKs, such as Python, visitors are the servers running the SDK. Multiple requests on a specific language are handled as one on the server running the SDK, so they will count as a single visitor.
The graphs displayed are:
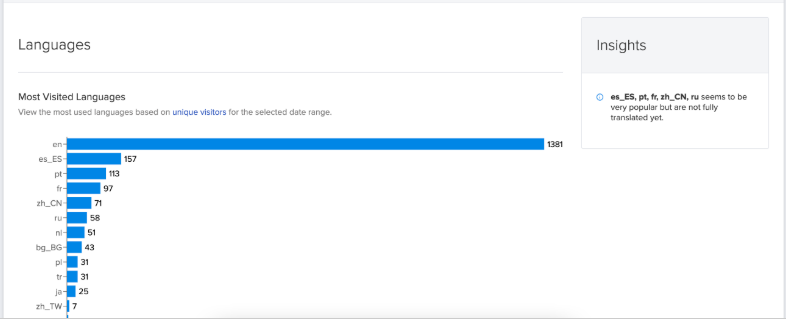
- Most visited Languages, which displays the unique visitors count per requested language locale. In this graph, you can see the top 13 visited languages.
-Language Usage Timeline, displaying unique visitors per language locale stacked per day of the selected period. You can click the locales displayed on the legend to hide or display them in the graph. - Native SDK usage timeline, that displays unique visitors count per Native SDK version that is handling the request. If you are using multiple versions of the same SDK, for example, an outdated and a newer Javascript SDK version together, you will see two different counts per version. You can click the SDKs displayed on the legend to hide or display them in the graph.
Insights box
The insights box will display information relating to the most used locales with the localization completion of each locale, providing hints on where you can focus to maximize the impact of localization on your unique visitors.

Updated 3 months ago